EHLS: Strongest Monthly Return Since November 2024
- Oct 8, 2025
- 6 min read
As AI-Theme Continues

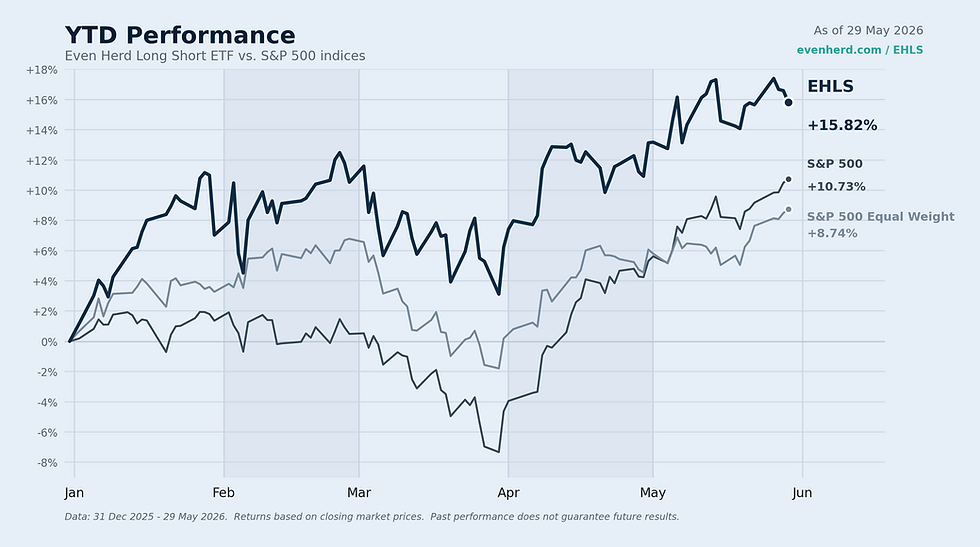
We’re thrilled to report the fund’s strongest month since November 2024, with the fund gaining 5.15% (MKT), outperforming the S&P 500’s gain of 3.53%. Since the August 2024 low, the fund has slightly underperformed the S&P 500 while maintaining a significant short portfolio overlay, yet holds a double-digit percentage lead over the S&P 500 Equal Weight Index.
EHLS maintains significantly less concentration than the S&P 500, where the top ten index components comprise nearly 40% of the index, while the fund’s top ten accounted for less than 14% at month-end with only 62.14% net equity exposure.
IN THIS UPDATE
Speculative Strength: Speculative stocks like Oklo Inc. have aided fund performance, with careful management through tax redemption to trim high-risk positions, maintaining diversification despite the strong AI-themed trade rising further.
Market Breadth Improvement: Market breadth has improved, with storage and memory stocks like Seagate Technology, Western Digital, and Micron joining the AI rally, while the fund's "sea level" indicator reflects strengthening market trends.
Exposure Adjustment: The fund adjusted its net equity exposure to 62.14% by September 2025, reducing short exposure due to a sharp market reversal, indicating renewed market strength although unusual without a post-recession catalyst.
Historical Trends: Historical "sea level" trends suggest the markets are strengthening, with plenty of room to run with current data showing 66% of stocks above this level, far from the 93% peak in April 2021.
Sector Leadership: Financials lead sector performance, followed by Materials and Industrials, while Healthcare shows potential for increased exposure, and the fund expects sustained market strength without expanding short positions soon.
LOOKING BACK
Speculative stocks continue to gain strength, boosting certain high-risk positions in the fund, such as Oklo Inc. (OKLO), which briefly became the fund’s largest holding. While we prioritize upside potential, this fund serves as a core equity alternative, and as such, we strive to manage these positions carefully by using the tax redemption process to trim high flyers. The AI-themed trade continues to accelerate, as discussed in prior updates, and we’ve had to forgo some opportunities to avoid overexposure to specific clusters, as the fund emphasizes diversification. But, away from the AI-trade, we are observing a continuing improvement in market breadth (the extent of participation in market trends), which we’d like to focus on in this update.
Given the discussion around the short portfolio weighing on upside participation over the last few months, we’d like to highlight features within our system that guide this exposure. Our system tracks a level comparable to tools used to measure market breadth, which we liken to a “sea level” for illustration purposes. When the sea level is extremely low, it implies that stocks, on average, are performing well, with most “treading above water.” Conversely, when the sea level rises, stocks, on average, begin to wane, falling “under water” and likely performing poorly.
Before the fund’s launch in April 2024, the sea level was trending aggressively lower, indicating a strong upward market trend. However, immediately after the launch, this trend stalled and remained flat through mid-March 2025, which is one of the longest and trendless market periods in our data since 1999 when observing this measurement. A negative trend began to form in March 2025, continuing into early July, prompting us to reduce net equity exposure. However, this level sharply corrected, reflecting renewed market strength. As a result, we have again reduced short exposure faster than anticipated, with net equity exposure closing the month at 62.14% compared to 53.78% the prior month. This kind of sharp reversal higher is unusual without a post-recession catalyst.
Typically, the “sea level” rises and falls more gradually, allowing the fund to adjust with market tides slowly. The rapid moves this year have been jarring, leading to more significant changes in our net exposures than usual. Historically, this level often rises signaling market weakness despite index performance. For example, a “bottom” in the level was observed in April 2021, followed by a steady rise before market indices peaked in December 2021. Similar patterns occurred in 1999 and 2007, which would have allowed the fund to increase short exposure prior to a meaningful decline, if managed then. Additionally, these tide reversals typically happen near extremes, not towards the center where the indicator previously resided.
This trend also alleviates concerns about an imminent recession or deteriorating economy, which much of the financial news has focused on due to recent Fed rate cuts and potentially weakening employment figures. But, we should point out, Goldman Sachs released a chart showing the S&P 500 has rallied on average 50% twenty-four months after the first Fed cut if no recession occurred. Our system suggests that markets currently disagree with a negative outlook, indicated by strengthening breadth. Additionally, there’s ongoing discussion about markets being in a bubble.
Sam Jurrens, Even Herd CEO, addressed this in last month’s “Observing the Herd” article, arguing that if the markets or the AI-theme are in a bubble, it does not appear to be near the top, at least yet. Our systems currently validate this thesis. However, these opinions do not guide the portfolio. Instead, our system does, which has allowed for the fund to increase net exposure during September in conjunction with this positive outlook.
FROM "OBSERVING THE HERD"
"AI’s reach is far greater, capable of accelerating and sprawling into nearly every industry." – Sam Jurrens, CEO
LOOKING FORWARD
Given the renewed strength in this level’s trend, we expect markets to continue strengthening, and we do not anticipate expanding the short side of the portfolio in the near term. We expect net equity exposure to remain around current levels or potentially increase into the months ahead. We’ll provide further insights in next month’s update, as this could change given recent market volatility. However, such rapid shifts are not typical based on historical data. Currently, there is also ample room for the sea level to continue falling. For context, in April 2021, over 93% of stocks tracked by our system were above sea level; today, roughly 66% are above this level. While we don’t expect a return to 2021 extremes, this serves as a reference point that markets can continue to gain strength.
In a normal market, trends exist on both sides, up and down. However, a sharp decline in sea level indicates that stocks across the board are strengthening, which can adversely impact the short portfolio. But, it should be noted, extremely short, sharp moves in either direction are difficult to manage. We would be surprised though to see a rapid reversal in the opposite direction within the next month, necessitating a quick reduction in net equity exposure. As always, nothing is impossible, so we’ll continue to monitor and provide an update moving forward.
In terms of sectors, Financials continue to lead, though the gap is consistently narrowing with Materials, supported by strength in precious metals, and Industrials, driven by the Space and AI-themed trade. Real Estate remains a challenging sector for meaningful exposure. Healthcare appears to be gaining some recent strength, and we’ll closely monitor this trend, potentially increasing net exposure if it continues.


Comments