
EHLS: New Closing Highs
AMID TECH STRENGTH |
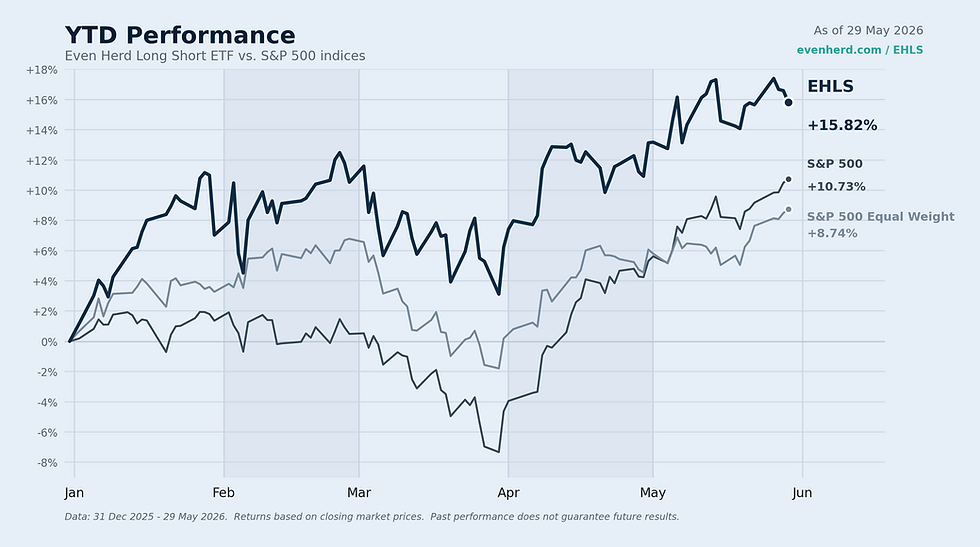
EHLS & Indices YTDEHLS Up +13.16% YTD (MKT, 4/30/2026)  Explore our daily released fact sheet for a closer look at recent portfolio highlights. |
The chart reflects market prices (MKT). The fund's expense ratio is 2.62%, which includes estimated dividends and interest expense on short positions. If this were excluded, the expense ratio would be 1.15%. The fund's inception was 4/2/2024. The performance data quoted represents past performance. Past performance does not guarantee future results. The investment return and principal value of an investment will fluctuate so that an investor's shares, when sold or redeemed, may be worth more or less than their original cost, and current performance may be lower or higher than the performance quoted. For standardized performance, visit https://www.evenherd.com/ehls.
The fund closed April at its highest month-end price since inception, delivering +13.16% (MKT) year-to-date compared to the S&P 500 at +5.31%. The index posted its strongest month since 2020, gaining +10.42% in April, and we are pleased to have captured meaningful upside with a +6.52% (MKT) monthly return. As is typical during sharp, broad equity advances over compressed periods, the short book in the portfolio acted as a detractor. Even so, the fund’s structural positioning in Energy, Materials, and Utilities, combined with disciplined exposure management, allowed us to participate while extending our year-to-date lead.
IN THIS UPDATE |
• The fund delivered +6.52% (MKT) in April and now stands at +13.16% (MKT) year-to-date, against the S&P 500 at +5.31%. |
• Energy continues to show the strongest lead in the system, with Materials and Utilities maintaining healthy positions in the top tier. |
• Industrials, Financials, and Health Care have moved into the next tier of sector strength and appear poised to hold near-term. |
• Consumer Discretionary remains near the back, Consumer Staples sits in last, and Real Estate is showing early signs of improvement. |
• Semiconductors and the broader AI trade exploded higher, contributing meaningfully but also concentrating the largest pocket of upside volatility within the long book. |
• The fund closed April at roughly 61% net equity exposure, with the range continuing to fluctuate between 55% and 65%. |
LOOKING BACKA HISTORIC MONTH FOR EQUITIESApril will be remembered as one of the strongest months for U.S. equities in years. The S&P 500 gained +10.42%, its best monthly performance since 2020. The rally was broad but uneven, with semiconductors leading dramatically. The PHLX Semiconductor Index (SOX), a modified market-cap weighted index of the 30 largest U.S.-listed semiconductor companies, posted one of its strongest stretches in over two decades, with select AI-linked names like Micron, Broadcom, and Nvidia gaining between 20% and 40% in the month alone. When markets snap back this aggressively, a long/short portfolio’s short book naturally acts as a detractor. We design the fund to participate meaningfully on the upside while providing structural protection on the downside, and short-side losses during compressed equity rallies are part of that tradeoff. Despite this headwind, the fund’s +6.52% (MKT)monthly return reflects the strength of the long book and the timeliness of our sector positioning. GEOPOLITICAL HEADLINES, MARKET INDIFFERENCEGeopolitical risk has remained volatile in the headlines through April. The conflict involving Iran and the broader Middle East continues to generate significant uncertainty, and oil prices remain elevated relative to where they began the year. Yet equity markets have largely shrugged off the noise, choosing instead to price in the resilience of corporate earnings and the durability of the AI-driven capital cycle. This dynamic has played directly to the fund’s advantage. Energycontinues to show the strongest lead in the system, supported by both the geopolitical premium in oil prices and the structural domestic demand story. Our Energy exposure remains concentrated in midstream infrastructure, offshore, and shipping, areas that are well-positioned regardless of how the Middle East situation evolves. TechnipFMC (FTI)remains one of the fund’s largest positions and contributed steadily through the month. Within midstream, DT Midstream (DTM) added roughly +10%, NGL Energy Partners (NGL) gained over +31%, and Solaris Energy Infrastructure (SEI) climbed roughly +31%, all of which speak to the durability of U.S. energy infrastructure demand alongside the geopolitical tailwind. MATERIALS AND PRECIOUS METALS: STILL IN THE LEADMaterials continues to occupy a top-tier position in the system, anchored by the precious metals mining cluster that has led the portfolio for nearly a year now. April brought a brief pause in the precious metals trade, with names like Agnico Eagle (AEM), Sprott (SII), and Alamos Gold (AGI)giving back roughly 7% to 10% as gold consolidated from the highs reached in late February. Despite the pullback, no name in the precious metals mining cluster has slipped into the bottom half of stocks we track. The system continues to support broad long exposure to the theme, and we expect that stance to continue. Outside of precious metals, Hudbay Minerals (HBM) and Cameco (CCJ) added meaningfully on the back of continued strength in copper and uranium. We remain mindful of the limited shorting opportunities within Materials and continue to manage concentration through diversification across individual names. SEMICONDUCTORS AND THE AI TRADEThe most explosive move in April came from semiconductors and AI-linked hardware. Memory names like Micron rallied roughly 40% in the month, with comparable strength across companies tied to high-bandwidth memory, advanced packaging, and AI infrastructure spending. The fund has meaningful exposure here through positions including Micron (MU), AXT (AXTI), Lumentum (LITE), Lam Research (LRCX), and Seagate (STX), among others. Within the long book, Seagate (STX) delivered the standout performance of the month, gaining roughly +72% as memory and storage demand tied to AI infrastructure repriced significantly. Other notable contributors among held positions included TTM Technologies (TTMI) at +62%, Vicor (VICR) at +67%, Celestica (CLS) at +45%, Broadcom (AVGO) at +35%, and Alphabet (GOOGL) at +34%, the latter of which remains one of the fund’s largest single positions. These names have driven significant contribution to the long book, but they also represent the largest pocket of risk within the portfolio. The AI trade has now extended across industries, from utilities and grid infrastructure to capital equipment and memory. AI’s pace of development has only accelerated, and conceptually we remain highly attentive to the physical limits the theme is now beginning to encounter, whether power, water, manufacturing capacity, or rare earth inputs, as demand continues to soar. We will continue to watch for any meaningful risks. For now, the system continues to support exposure here, and we remain disciplined about managing concentration within the cluster. As always, we have benefited from following the system, which previously guided us to liquidate names like Spotify, Robinhood, and Roblox before earnings-driven declines. The system also exited several positions during April, including Tesla, Ormat Technologies, Mirion Technologies, and Cloudflare, as their respective rankings deteriorated, while opening new long exposures in areas including financials and select communication services names. The same framework that helped us avoid past drawdowns is what keeps us engaged with semiconductors today, while continuing to look for ways to dampen volatility in this pocket. Upside volatility, while welcome, makes for a more delicate dance than downside volatility. LOOKING FORWARDSECTOR POSITIONINGEnergy, Materials, and Utilities remain the top tier of the system. Energy holds the strongest current lead, but Materials and Utilities continue to rank well, and we anticipate these three sectors holding their leadership through May. Industrials, Financials, and Health Care have moved into the next tier of sector strength. Each has shown improving relative momentum, and they appear positioned to maintain that strength in the near term. We will continue to look for opportunities to add exposure within these sectors as the system identifies them. Consumer Discretionary has lagged and remains near the back of the rankings, while Consumer Staples sits in last. Exposure to both remains light. Real Estate has been a persistent laggard but is showing early signs of improvement. If that improvement continues, we could see the sector begin to move up the ranks in coming months. NET EXPOSURE AND THE SEA LEVELThe fund closed April at roughly 61% net equity exposure, comfortably within our recent range of 55% to 65% and trending toward the higher end. Our “sea level” breadth indicator has remained relatively stable throughout 2026, which has caused our exposure to not change meaningfully. The sharp decline through late March followed by April’s robust recovery was simply too compressed to generate any major shift in our underlying breadth signal. Barring a meaningful broad decline, we expect net exposure to remain above 60% through the month ahead. Should breadth deteriorate, we will not hesitate to reduce, but the current data does not suggest that move is imminent. NAVIGATING THE CURRENT ENVIRONMENTThe combination of geopolitical headlines that markets are choosing to look past, an AI cycle that continues to accelerate beyond expectations, and a clear sector rotation favoring tangible, infrastructure-linked businesses creates an environment that has played well to the fund’s strengths. We are not making predictions about where the next leg of this market goes. The system has positioned us well, and the system will continue to dictate adjustments. As always, we remain focused on managing volatility, maintaining diversification across clusters and individual names, and letting the strongest themes compound. When rankings deteriorate, positions get cut. When new strength emerges, the system identifies it. That discipline is what has driven our year-to-date results, and it is what we expect to carry the fund forward. |
The Even Herd Long Short ETF (EHLS) is a relative momentum-driven long/short equity strategy. For more information, visit evenherd.com/ehls.


Comments