
EHLS: A Broader Short Book, Led by the System
Quarter ended September 30, 2026

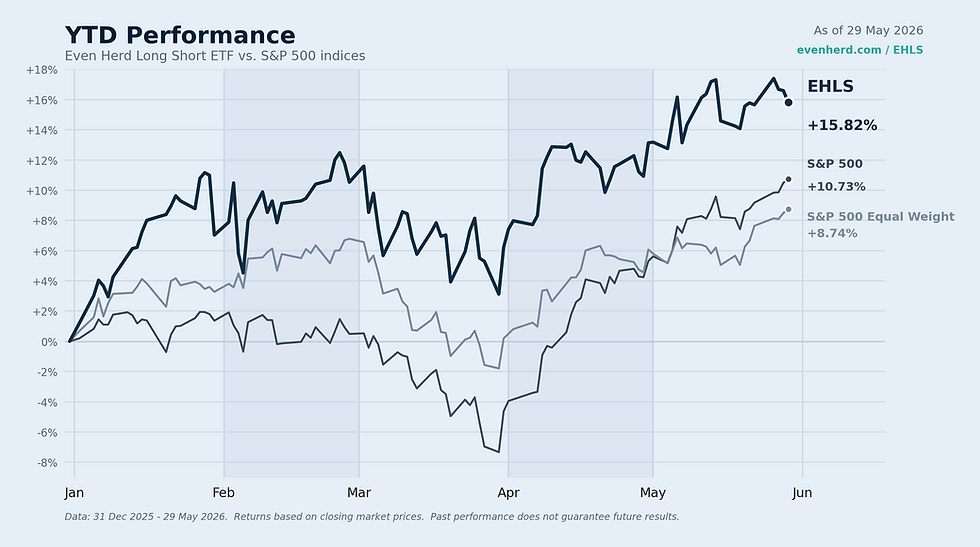
EHLS market price (MKT) per share, year to date
The chart reflects daily closing market prices (MKT) from 12/31/2025 through 9/30/2026. The year-to-date return shown is based on market price (MKT); the fund made no distributions during the period. The fund’s expense ratio is 2.62%, which includes estimated dividends and interest expense on short positions. If this were excluded, the expense ratio would be 1.15%. The fund’s inception was 4/2/2024.
The performance data quoted represents past performance. Past performance does not guarantee future results. The investment return and principal value of an investment will fluctuate so that an investor’s shares, when sold or redeemed, may be worth more or less than their original cost, and current performance may be lower or higher than the performance quoted. For standardized performance, visit https://www.evenherd.com/ehls.
Performance (NAV) | Positioning | ||
NAV per share | Q3 NAV change | Net exposure | Gross exposure |
$25.58 | −4.52% | 54.4% | 145.1% |
Sep 30, 2026 | Jun 30: $26.79 | ▼ 17.5 pts in Q3 | ▲ 16.6 pts in Q3 |
The NAV per share and Q3 NAV change figures reflect net asset value (NAV), not market prices, and represent past performance. Past performance does not guarantee future results. See the performance disclosure accompanying the chart above, including the fund’s expense ratio. For standardized performance, visit https://www.evenherd.com/ehls.
EHLS ended September with a net asset value of $25.58 per share, a decrease of 4.52% over the third quarter. The period brought sharp reversals in several established long holdings alongside continued strength in selected health-care and energy names. The contrast between improving corporate results and weakening share prices was a recurring feature of the quarter.
The short book expanded meaningfully in September in response to our system’s indicators. Short exposure rose from 24.8% of NAV at August-end to 45.4% at September-end, while long exposure remained close to 100%. Net equity exposure consequently declined to 54.4%. This change reflects the opportunities identified by the system and does not necessarily imply a view on the expected direction of the broader market.
Substantial indebtedness was a recurring characteristic of several new shorts. Debt levels are not a metric used to select short positions; those decisions are driven by our relative-momentum system.
Against a backdrop of rising long-term yields, it is unsurprising to see increased exposure to indebted companies as their relative price trends weaken. We expect this pattern to remain relevant if financing pressures persist, with positioning continuing to follow the system’s signals.
IN THIS UPDATE
• Financials became the largest net sector exposure, while Energy remained a significant allocation. |
• Consumer Discretionary shifted to net short, and Utilities exposure was eliminated. |
• A broader short book reduced net exposure while increasing gross exposure and the importance of managing reversals. |
PORTFOLIO EXPOSURE
Month-end | Long | Short | Net | Gross |
June 30 | 100.2% | 28.3% | 71.9% | 128.5% |
July 31 | 99.6% | 26.2% | 73.4% | 125.7% |
August 31 | 100.4% | 24.8% | 75.6% | 125.2% |
September 30 | 99.8% | 45.4% | 54.4% | 145.1% |
Source: Even Herd. Exposures are percentages of net asset value. Shorts are shown as absolute values. Net exposure equals longs less shorts; gross exposure equals longs plus shorts. Figures may differ due to rounding.
LOOKING BACK
HIGHER YIELDS AND UNEVEN EQUITY LEADERSHIP
The interest-rate backdrop became more demanding as the quarter progressed. The 30-year Treasury yield reached 5.34% during August, according to Nasdaq’s market review. On September 16, the Federal Reserve raised its policy range by 0.25 percentage point to 3.75%–4.00%. Higher financing costs coincided with a recovery in software and selected large technology stocks following the summer’s semiconductor correction. Equity leadership remained uneven, with materially different outcomes across companies exposed to similar economic forces.
STRENGTH IN SELECTED LONG POSITIONS
Guardant Health (GH), our largest long position at 2.03% of NAV, reported 44% revenue growth and raised its full-year revenue outlook in July. Continued expansion in oncology and screening supported the business, although it remained loss-making. Its shares advanced during the quarter.
Forum Energy Technologies (FET) also advanced and ended the quarter at 1.11% of NAV. Its July results included $226 million of revenue and an increase in full-year guidance. The strength was consistent with continued demand for energy equipment and services across parts of our long book.
TechnipFMC (FTI), a 1.50% position, reported $2.5 billion of Subsea orders in July. Frequency Electronics (FEIM), which ended at 1.38% of NAV, reported record quarterly revenue of $23.5 million and a funded backlog of $129 million in September. These results illustrate the company-specific demand trends represented in the portfolio, from offshore energy development to specialized aerospace and defense electronics.
OPERATING GROWTH DID NOT INSULATE SHARE PRICES
Several established longs experienced substantial price declines, including Lincoln Educational Services (LINC), Carpenter Technology (CRS) and Rocket Lab (RKLB). Lincoln reported 22.4% revenue growth, but student starts increased just 1% and enrollment conversion weakened. The gap between current revenue growth and the pace of new student additions warranted attention.
Carpenter Technology reported record quarterly operating income, while Rocket Lab reported record revenue and backlog. Their share prices nevertheless fell over the quarter. For a strategy organized around relative momentum, such reversals are a material risk: the portfolio can remain exposed as previously strong trends deteriorate, and an improving business does not necessarily produce an improving stock price.
Fundamental developments provide useful context, while changes in the indicators determine how the portfolio evolves.
The quarter reinforced the importance of allowing the system’s ongoing reassessment of relative strength to inform positioning.
HOW THE PORTFOLIO EVOLVED
Financials replaced the spring’s heavier emphasis on Materials and Utilities as the largest net sector allocation. Energy remained prominent, Real Estate increased, and Consumer Discretionary moved to net short. These changes reflect the system’s assessment of relative strength across individual securities and sectors.
Net sector exposure | Jun 30 | Sep 30 | Change |
Financials | 10.3% | 16.4% | +6.2 pp |
Energy | 9.6% | 11.3% | +1.7 pp |
Real Estate | 5.0% | 7.5% | +2.4 pp |
Information Technology | 8.9% | 7.2% | −1.6 pp |
Health Care | 7.0% | 6.4% | −0.5 pp |
Materials | 7.8% | 3.4% | −4.4 pp |
Industrials | 7.6% | 2.8% | −4.8 pp |
Communication Services | 5.1% | 2.7% | −2.4 pp |
Consumer Staples | 3.6% | 2.5% | −1.1 pp |
Utilities | 6.4% | 0.0% | −6.4 pp |
Consumer Discretionary | 0.7% | −5.8% | −6.5 pp |
Source: Even Herd. Percentages of NAV; pp = percentage points. Changes reflect trading, price movements and changes in NAV. Sector classifications are as of preparation; figures may differ due to rounding.
Financials reached 16.4% net exposure through a larger long allocation and a smaller short allocation. Universal Insurance (UVE) remained a significant long at 1.85% of NAV; its July results showed premium growth and improved underwriting trends. Energy ended at 11.3% net, followed by Real Estate at 7.5%.
Utilities exposure was eliminated as relative rankings weakened. Entergy, Sabesp and Enlight Renewable Energy exited the portfolio over the quarter. At the same time, improving rankings brought new Technology longs, including Twilio and CrowdStrike. The system continued to identify opportunities on both sides of the portfolio.
A BROADER RANGE OF SHORT POSITIONS
Consumer Discretionary ended at 5.8% net short, combining 8.1% long exposure with 13.9% short exposure. Housing-related shorts included Builders FirstSource, Dream Finders Homes and Whirlpool, whose shares declined during the quarter. Additions elsewhere included Planet Fitness, Wingstop, Chipotle and ESAB.
Chipotle illustrates why a short position need not imply a deteriorating business. The company reported comparable-sales growth and raised its annual sales outlook in July, even as operating margins narrowed. Our short position was established in August. The system responds to relative price behavior, which can diverge from reported operating growth.
LOOKING FORWARD
CORPORATE LEVERAGE AND THE LONG END
The short book’s increased exposure to indebted businesses is an outcome of relative-momentum signals. Indebtedness itself does not drive our decisions to short. Planet Fitness and Charter entered the short book in July, followed by TransDigm in September; their quarter-end short exposures were 0.83%, 0.26% and 0.60% of NAV, respectively.
Planet Fitness reported approximately $2.55 billion of debt and borrowings at June-end and increased its annual net interest expense outlook. Charter reported $93.8 billion of debt principal. TransDigm’s June balance sheet carried approximately $33.5 billion of debt and short-term borrowings, and quarterly net interest expense increased year over year. These companies also reported positive earnings or cash generation; indebtedness alone does not establish financial distress.
Higher long-term yields can increase refinancing costs and the returns investors require from equities. The impact depends on debt maturities, fixed versus floating rates, credit spreads, hedging and cash generation. Companies with fixed-rate funding may feel the effect gradually, while refinancing at higher coupons can absorb cash otherwise available for investment or shareholders.
It is therefore unsurprising to see these exposures increase when financing pressures coincide with weaker relative momentum. If long-term yields keep rising, indebtedness may remain a recurring characteristic of the shorts our system identifies. Positioning will continue to follow relative-momentum signals. Falling yields or stronger cash flows could support a sharp rally in leveraged equities, creating losses for short positions.
POSITIONING FOLLOWS THE INDICATORS
We enter the fourth quarter with 99.8% long exposure, 45.4% short exposure and 54.4% net exposure. The expansion of the short book is an outcome of the system’s indicators and should not be interpreted as a forecast of a broad market decline. We continue to take exposure where relative strength improves and adjust as those signals change.
Lower net exposure does not by itself mean lower overall risk. Gross exposure rose to 145.1%, and both sides of the portfolio can lose during abrupt reversals. The long book also includes rate-sensitive businesses, particularly within Real Estate. Managing these shared exposures remains important as individual positions evolve.
The Even Herd Long Short ETF (EHLS) is a relative momentum-driven long/short equity strategy. For more information, visit evenherd.com/ehls.


Comments